This is done per pixel. The sum of r, g and b must be equal to 1. Since b is just equal to 1- r - g, we only use r and g values. The values obtained from using the formula above must between 0 and 1. The chromatic information is stored in r and g while the brightness information is in I.
I will be working on the image of a flower below.
 |
| Test Image |
My goal is to separate the color yellow from the image. The expected result is an image that only shows the parts of the picture that correspond to the color yellow. So, from the image, I will crop a part of the petal.
The figure below shows the cropped part.
 |
| Cropped part of the image (petal) |
This is the shade of yellow that I want to separate from the whole image.
PARAMETRIC PROBABILITY DISTRIBUTION
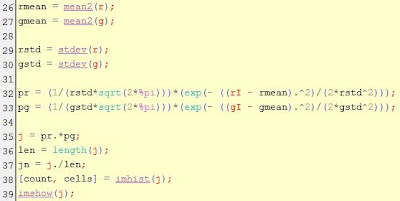
First, I will get the RGB values of the cropped image and use the equation above to get the correspond r-g values in the NCC coordinates. Then, I will get the mean (μr ,μg) and standard deviation (σr ,σg) of the the r and g values. Using the calculated mean and standard deviation, I can get the probability that a particular pixel belongs to my region of interest which is the petals of the flower. The probability is computed by substituting the values of the mean and the standard deviation in the equation below.
However, the r and g values used in the formula above is the corresponding r and g values of the whole image. The code used to implement parametric probability distribution is as follows:
 |
| Code for obtaining the r and values of the cropped image and the whole image |
 |
| Code for getting the probability that the pixel belongs to the ROI |
The result of the color segmentation is shown below.
 |
| Original image (left) and Color Segmentation result (right) |
NON-PARAMETRIC PROBABILITY DISTRIBUTION
In this approach, you need not get the mean and standard deviation of the cropped image. You only the histogram of the cropped image. The following two figures show the code for getting the 2D histogram of the cropped image.
 |
| Code for getting the 2D histogram of the image |
The 2D histogram of the cropped image must have peak at the point that corresponds to our color of interest if compared to the normalized chromaticity diagram.
 |
| Normalized Chormaticity Diagram (left) and 2D histogram of the cropped image (right) |
 |
| Code for the Histogram Backprojection |
The result of the backprojection is shown below.
 |
| Original Image (left) and result of the histogram backprojection (right) |
For this activity, I give myself a 10/10 for accomplishing the task at hand.
I would like to thank Ma'am Jing for helping me understand the concept and for Krizia Lampa for helping me debug the code. :)
Reference:
1. Soriano, M., A11 - Color Image Segmentation 2010


No comments:
Post a Comment