Monday, September 24, 2012

Video Processing : Tracking Objects


A video is composed of a sequence of images in rapid succession such that the objects, as you browse through the images, appear to be moving. Thus, image processing can be done on these images by looping through them and applying the same algorithm to each image. 

In commercial cameras, they describe the rate at which a video is captured by fps or "frames per seconds". The most common cameras has 30fps. For this activity, the fps of a Canon 550D is 50. Since the time interval is just the inverse of the frame rate, the time interval between successive images is 0.02 seconds. 

The goal of the activity is to observe the spread of a red dye in water – hot, cold, and tap. The dispersion of the red in water is tracked using color segmentation.

From the last activity, the most effective method for color segmentation is the non-parametric probability distribution estimation. This is done by getting the histogram of a region of interest.  The color we perceive usually varies due to the uneven level of brightness in an object ,thus, the color space used is the NCC (normalized chromaticity coordinates) which separates the chromaticity and color information. The histogram of the ROI (region of interest) represents a blob in the NCC diagram. Through histogram back projection, each pixel location in the image has a corresponding value equal to the histogram value in the chromaticity space. These new set of values make up the image which should show part of the original image that has the same chromaticity as the region of interest.

The figure below shows the area of the red dye when it first touched the water. 

Area of the the red dye as it touched the water 

The red dye was allowed to spread for 30 seconds.  The video was parsed into images using Avidemux with a total of 75 images for processing.
For each image, color segmentation  through non-parametric probability distribution was done. The algorithm was looped through each image.

Histogram and result of segmentation
Plot of the area versus the image number
It can be observed that after 30 seconds, the red dye was observed to spread significantly. In order to quantify its dispersion for the 3 set-ups, the mean and the standard deviation of the area for all the images were computed. The table below shows the mean and standard deviation for the hot, cold and tap water setup.

Mean and Standard Deviation of the Area of Dispersion of  the Red Dye

Among the 3 setups, the red dye spread most widely in the hot water setup. This is due to the fact that water molecules in hot water move faster than in cold water, thus, making the dye spread faster in the medium.

I give myself a 10 for accomplishing the tasks required in this activity. J
References:
1.       Soriano, M., Activity 11 – Color Segmentation.
2.       Soriano, M., Basic Video Processing


Wednesday, September 12, 2012

Color Image Segmentation

It is difficult to separate colored parts of a color image if it is converted to grayscale then use thresholding for segmentation. Thus, the only approach is to segment the parts by using the color image itself, no conversion needed. However, in the case of objects with differing level of brightness such as 3D objects, it is not advisable to use the RGB space. Instead, one can convert RGB to NCC (normalized chromaticity coordinates). This color space allows separation of brightness and chromaticity. To compute for the values of the red, green and value for NCC, here is the formulae:


This is done per pixel. The sum of r, g and b must be equal to 1. Since b is just equal to 1- r - g, we only use r and g values. The values obtained from using the formula above must between 0 and 1. The chromatic information is stored in r and g while the brightness information is in I.


 In this activity, two approaches were used for color image segmentation - the parametric and non-parametric probability distribution.

I will be working on the image of a flower below. 


Test Image

My goal is to separate the color yellow from the image. The expected result is an image that only shows the parts of the picture that correspond to the color yellow. So, from the image, I will crop a part of the petal. 
The figure below shows the cropped part.


Cropped part of the image (petal)

This is the shade of yellow that I want to separate from the whole image. 

PARAMETRIC PROBABILITY DISTRIBUTION

First, I will get the RGB values of the cropped image and use the equation above to get the correspond r-g values in the NCC coordinates. Then, I will get the mean (μr g) and standard deviation r g) of the the r and g values. Using the calculated mean and standard deviation, I can get the probability that a particular pixel belongs to my region of interest which is the petals of the flower. The probability is computed by substituting the values of the mean and the standard deviation in the equation below. 


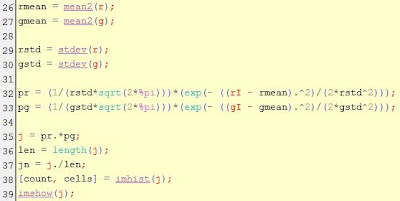
However, the r and g values used in the formula above is the corresponding r and g values of the whole image. The code used to implement parametric probability distribution is as follows:


Code for obtaining the r and values of the cropped image and the whole image
Code for getting the probability that the pixel belongs to the ROI

The result of the color segmentation is shown below. 


Original image (left) and Color Segmentation result (right)

NON-PARAMETRIC PROBABILITY DISTRIBUTION

In this approach, you need not get the mean and standard deviation of the cropped image. You only the histogram of the cropped image. The following two figures show the code for getting the 2D histogram of the cropped image. 


Code for getting the 2D histogram of the image

The 2D histogram of the cropped image must have peak at the point that corresponds to our color of interest if compared to the normalized chromaticity diagram. 


Normalized Chormaticity Diagram (left) and 2D histogram of the cropped image (right)
By estimation, the peak shown in the 2D histogram covers to both the light green and the light yellow in the the normalized chromaticity diagram. Thus, we expect that it will also segment parts of the image that correspond to the light green parts of the image. Using the 2D histogram obtained, we use histogram backprojection to segment the image, leaving only those parts described in the peak of the 2D histogram. 


Code for the Histogram Backprojection

The result of the backprojection is shown below. 


Original Image (left) and result of the histogram backprojection (right)
As expected, it also showed the light green parts. However, comparing the accuracy of the segmentation, the non-parametric probability distribution is better than the parametric probability distribution.

For this activity, I give myself a 10/10 for accomplishing the task at hand. 

I would like to thank Ma'am Jing for helping me understand the concept and for Krizia Lampa for helping me debug the code. :)


Reference:

1. Soriano, M., A11 - Color Image Segmentation 2010

Monday, September 3, 2012

Applications of Morphological Operations Part 3 of 3

Image processing has made it a lot easier to automate naming of parasites in the human blood. Most of the parasites that attack the red blood cells cause the RBCs to have an enlarged shape - bigger than the normal. For example, when a person is affected with malaria, the image below should be seen under the microscope.

Plasmodium vivax

 This one is the case when the parasite present is Plasmodium vivax. It can be observed that the RBCs are larger than the normal.

In this activity, we are given an image of scattered punched papers which we will consider as cells. Th goal is to use all the image processing techniques that we have learned in order to get the area (in pixel count) of the "cells".


First, we are given the image below. The whole image will be cut into 256 x 256 subimage.


Original image


Here is the first sub-image.

1st Sub-image

I first worked on this image. I got the histogram of the image in order to get rid of those that are not cells. 

Histogram of the 1st sub-image
From the histogram of the image, I used SegmentByThreshold () of IPD to isolate the cells. The threshold is at 220. 

Binarized version of the thresholded image

I masked the image above so that we'll be able to isolate the cells. This is the best I can do to separate them. See image below.

Isolated Cells

I used a Bounding Box to emphasize the isolation. However, they were both enclosed in one box. I took the area of this cells inside by taking the length of the pixels which are true in this image and divided it by 2 since there are two circles. I got 510. So for now, this will be my "theoretical" area. This will help me easily filter the other sub-images such that I will only be calculating the isolated cells.

Since I now have a "theoretical" threshold. I will start processing the sub-images. I will use the FilterBySize() function of IPD, setting my SizeThreshold to 510. This means that filter those pixels with sizes less than 510.
To make sure that I am getting the correct area, I have another threshold which I set at 550. Using the same function. this will only show cells greater than the cells of interest. I subtracted the latter image to the former, giving me an image of the cells of interest only. Thus, it is easier for me to know their areas. 

Isolated Cell of Interest

To get the area, we count the number of pixels tagged wit the same number by AnalyzeBlobs () function of IPD. The area of this cell is 517 pixels. I will repeat the same procedure to the other sub-images and tally the area of isolated pixels. The code for getting the area is shown below.


s = length(BlobStatistics);
for i = 1:s
    [area(i)] = length(find(Filt_image1 == i));
end

BE = mean(area);
SD = stdev(area);
disp(area');


However, it was hard to automate the whole process. It was hard to have just one threshold for all the images. So, I have to get the area of the cells for all the sub-images manually.

The best estimate was determined to be 639 pixels with a standard deviation of 485.


ISOLATION OF CANCER CELLS

Another image of scattered punched papers was given to us. However, in this image, the size of the punched papers are not uniform. The presence of bigger punched papers can be attributed to "cancer" cells. The goal of the next part of the activity is to isolate the "cancer" cells n the image and estimate their sizes.

Circles with Cancer

For easy processing, this image was cut into sub-images. Since the 1st sub-image contains a "cancer" cell, I just used to 1st sub-image to accomplish this part of the activity.

1st sub-image of the image with a cancer cell


Using the same procedure as the first part of the activity, the final results is shown below.

Isolation of Cancer Cells
The area of the cancer cell in the image is determined to be 818 pixels.

I give myself 9/10 for this activity because I was able to accomplish the tasks except for the looping.

I thank Krizia Lampa for the helpful discussions. :)

References:

1. Image Processing with Scilab and Image Processing Design Toolbox
2. Soriano, M., Applications of Morphological Operations 3 of 3: Looping through Images